HiveMQ Edge Workspace
The HiveMQ Edge Workspace is both an observability tool and an interaction interface for managing HiveMQ Edge. You can access the Workspace of your running HiveMQ Edge instance via the Workspace menu point in the main navigation menu of the HiveMQ Edge web application.
HiveMQ Edge Workspace Main View
When you open the HiveMQ Edge Workspace, a canvas with a map of all entities currently configured in your running HiveMQ Edge instance displays. These entities are referred to as ‘nodes’. The node with the HiveMQ Edge logo in the center of the canvas represents the Edge Broker. The interface also provides a configuration bar in the bottom left of the screen and a minimap view in the bottom right corner to simplify navigation on node-heavy views.

| The Workspace canvas is cached locally in your browser. The changes you make to your HiveMQ Edge configuration are not immediately reflected on the canvas. To manually refresh the view, select the HiveMQ Edge Workspace Configuration Panel. |
HiveMQ Edge Workspace Configuration Toolbar
The configuration toolbar bar is always available at the bottom left of your HiveMQ Edge Workspace to help you navigate and control the view.

The toolbar offers the following options:
-
Zoom in (+): Increases magnification on a specific area of the Workspace.
-
Zoom out (-): Decreases magnification on a specific area on the Workspace.
-
Fit to the canvas (dotted box), to centre all the nodes within the canvas window on your screen.
-
Lock the canvas (padlock), to stop nodes from moving on the Workspace canvas while you navigate and select nodes.
-
Workspace configuration (sliders), brings up additional options for the Workspace.
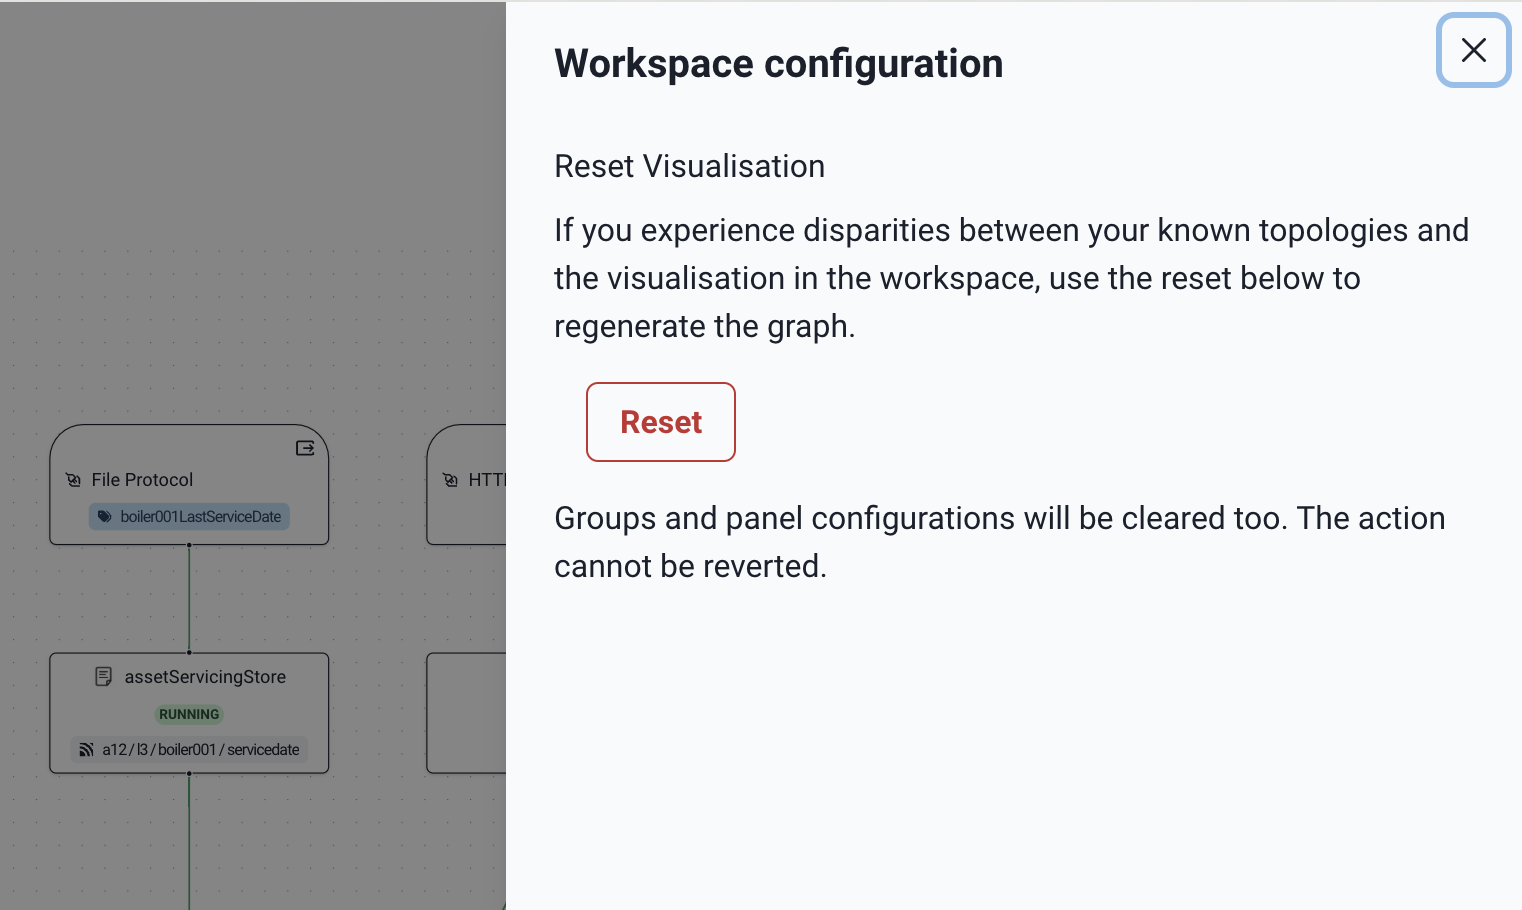
HiveMQ Edge Workspace Configuration Panel
The Workspace configuration button (sliders) brings up additional options that enables users to:
-
Reset Visualisation: This option removes changes made to the configuration of your running HiveMQ Edge instance or the HiveMQ Edge Workspace canvas.
| The Reset Visulaization option clears Groups and panel configurations. The action cannot be undone. |
HiveMQ Edge Workspace Elements
Nodes on the Workspace canvas are connected by different colour lines (called links) to visualise the status of the data relationship between the nodes.
-
Green denotes a healthy connection and a flow of data is enabled between the nodes.
-
Red denotes that a connectivity issue is present. Users should check the connection status or configurations to resolve this.
-
Black is used for showing data relationships between nodes on the canvas.
HiveMQ Edge Workspace Observability Panels
Each link line where MQTT data is flowing is labeled with an analytics symbol:
The analytics symbol provides quick access to an associated observability panel:

By default, each observability panel provides a ‘Publish success (count)’ metric. To add further metrics, select the Configure the metrics option on the panel. The panel automatically adjusts to list the available metrics and view types. To add a metric or view type, select Add to panel.
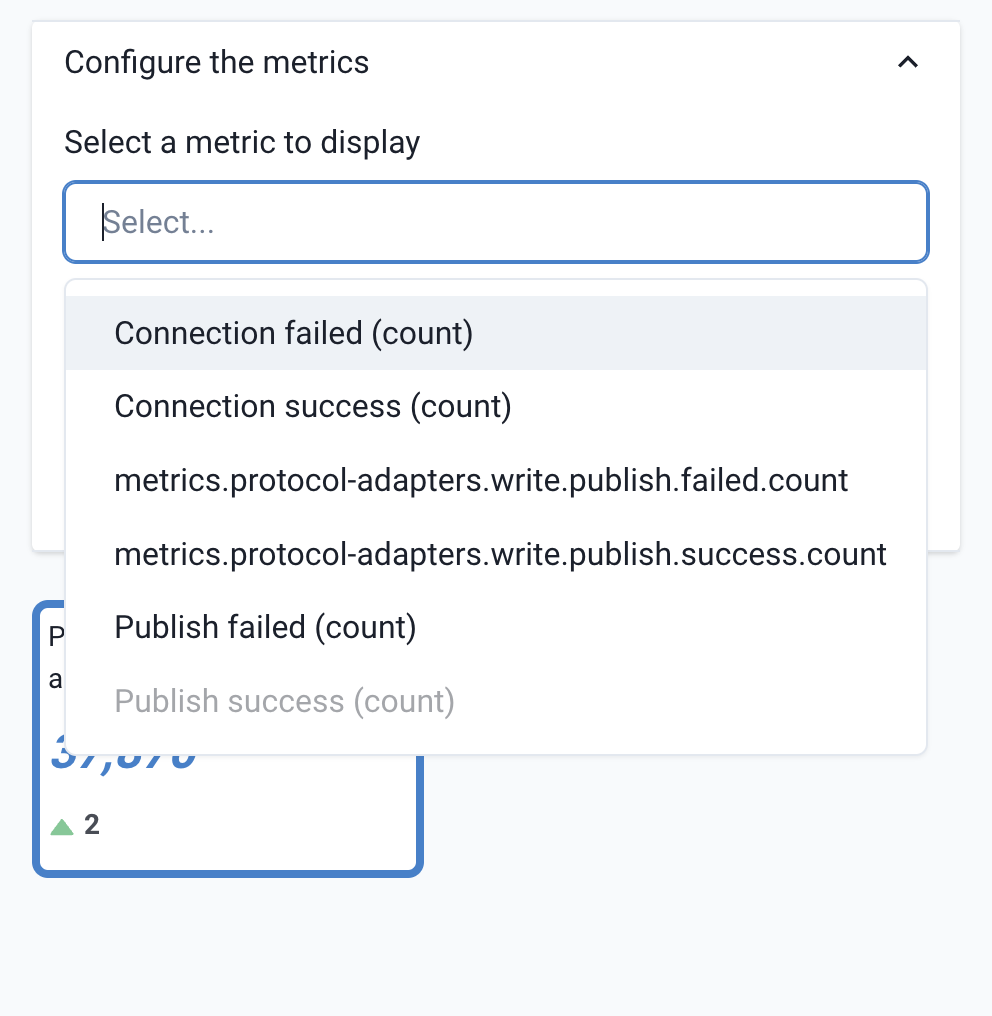

Once you’ve chosen an additional metric and chart type you can add it to the panel.

| The persistence of metrics is not supported. Values are computed from the moment the observability panel is opened. When you close the panel, all values except the last one will be discarded. |
HiveMQ Edge Workspace Adapter Grouping
Protocol Adapter nodes can be grouped on the canvas to provide group views in your Observability Panels. To do this, drag and select or modifier-click multiple Protocol Adapter nodes to initiate a group.

Next, select the Group the selected adapters option from the provided entities overlay toolbar:
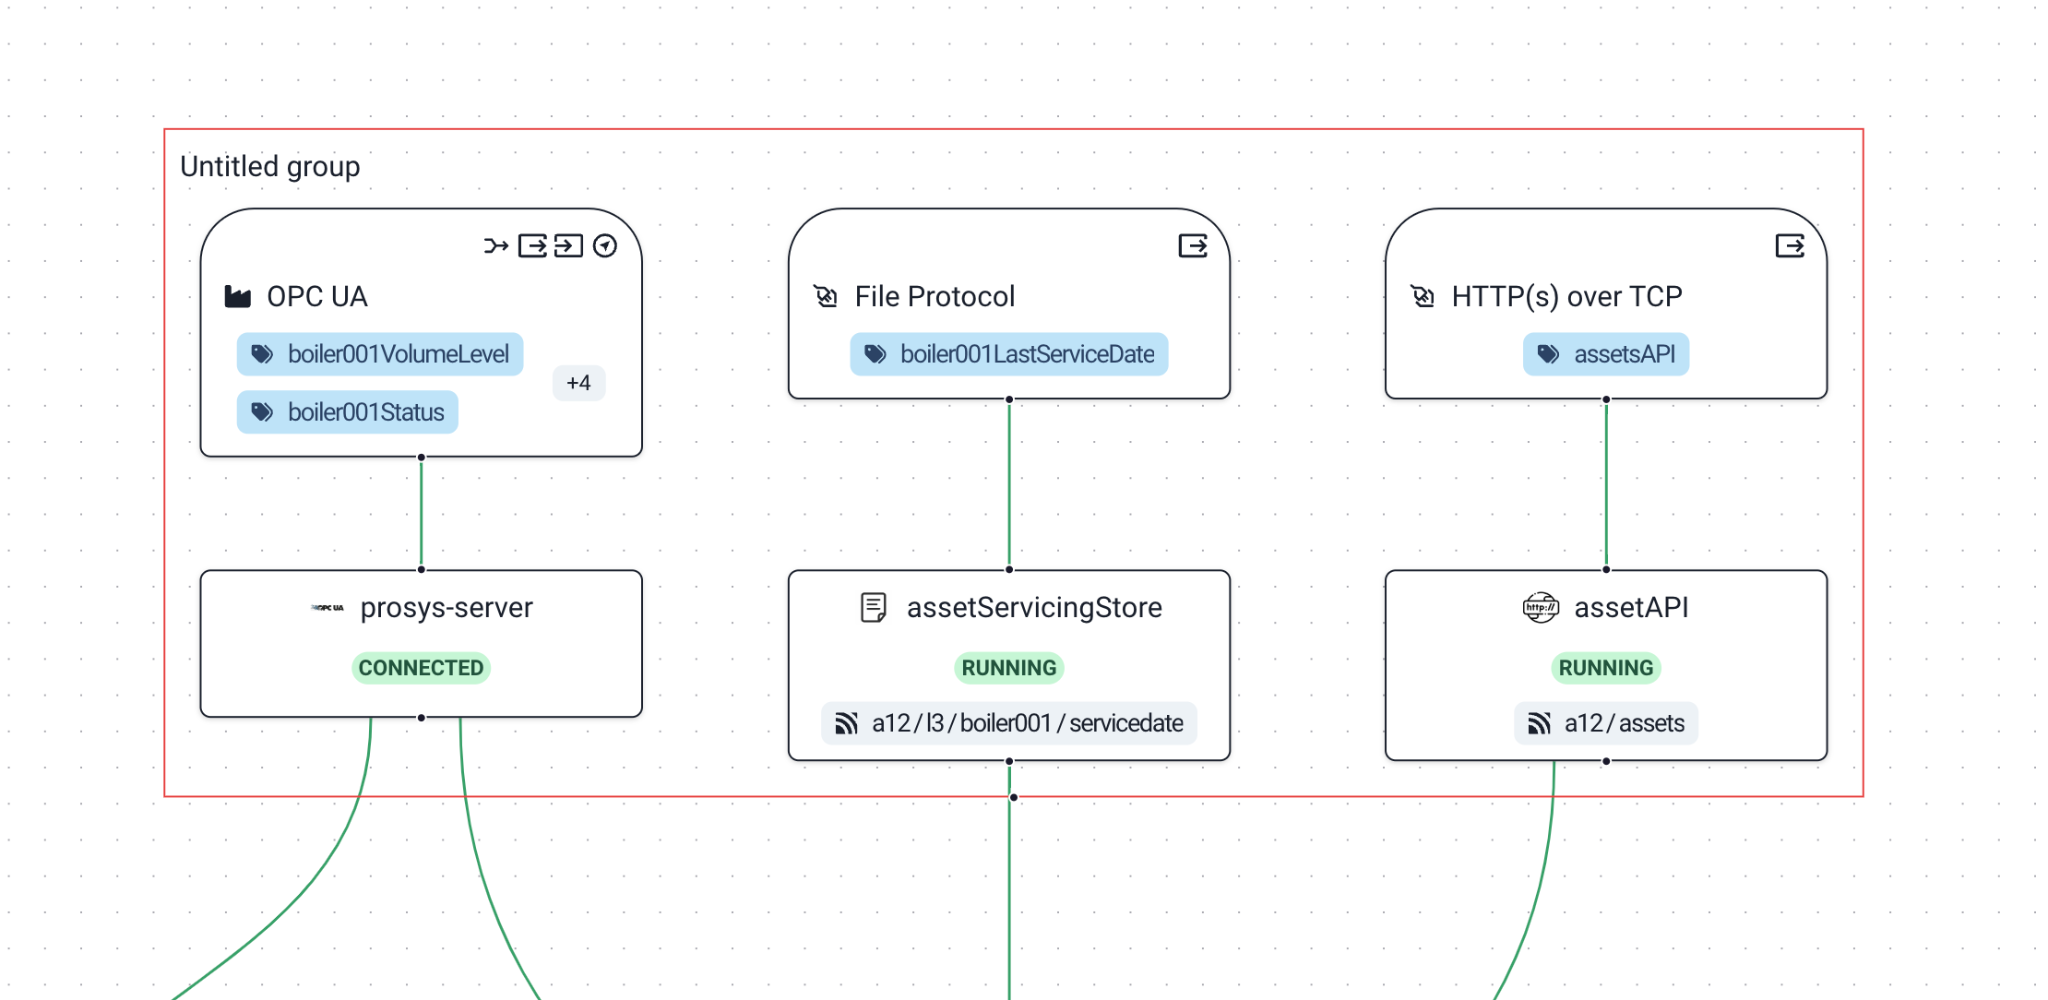
This action creates an ‘Untitled group’. Click the new group to display a set of options specific to the group:

The overlay toolbar options available when you select a group are:
-
Collapse group (four converging arrows): Enables you to modify the canvas and collapse the connectivity lines for all the nodes into a single line.
-
Ungroup (box with an x): After a confirmation, ungroups the nodes.
-
Open the overview panel (sidebar icon): Opens the Overview Panel from the right side of the screen.
|
Not all nodes can be grouped. Currently, only adapters are supported. Other selected nodes can not be added to the group. Nodes in a group cannot be added to another group. |
HiveMQ Edge Workspace Group Observability Panel
To access the Observability panel, select Open the overview panel on the group overlay toolbar. The panel from the right side of the screen.

The Observability panel has three tabs:
-
Configuration: The Configuration tab provides labelling and content options.
-
Events: The Events tab provides information from the event logs related to the grouped Protocol Adapters.
-
Metrics: The Metrics tab provides a combined metrics view from the singular Observability panels.

To close the Observability panel, select the x in the upper right corner of the panel.
HiveMQ Edge Workspace Nodes
There are 6 node types (or entities) that can be visible on the Workspace canvas: The Workspace canvas visualizes 6 types of nodes:
-
HiveMQ Edge Broker node: The central node on the canvas that represents the MQTT broker within HiveMQ Edge.
-
Bridge Configuration node: One or more configured MQTT bridge connections for message publication and/or subscription.
-
Bridge Destination node: The end point configured in a Bridge connection.
-
Protocol Adapter node: The configured protocol adapter connection to which MQTT topics are mapped.
-
Device node: The device associated with a protocol adapter and the mapped tags associated with the device.
-
Combiner node: The element that represents a configured data combination and its related sources.
HiveMQ Edge Workspace Broker Node
The HiveMQ Edge Broker node is always at the center of the Workspace canvas diagram. In terms of connectivity, this node represents the MQTT broker within the HiveMQ Edge instance. The Broker node is labeled with the HiveMQ Edge logo. If the node is configured, it displays topic filters. When you select the Broker node on the canvas, an overlay toolbar displays.

The overlay toolbar of the HiveMQ Edge Broker node provides the following options:
-
Manage topic filters (MQTT icon): Configure topic filters for use in other configurations.
-
Create a data combiner from selection (combination icon): Create a data combination from topic filters. This option is visible when the Broker node and another data source are selected.
-
Open the overview panel (sidebar icon): Opens the Overview Panel from the right side of the screen.
HiveMQ Edge Workspace Broker Node Topic Filters
To access topic filters, select Manage topic filters on the overlay toolbar of the HiveMQ Edge Broker node. This option opens the Manage topic filters window.

The Manage topic filters window lists existing topic filters in a paginated view. Each line item has an action toolbar that allows you to manage, edit, or delete topic filters.
To add a new topic filter or edit an existing entry, select Edit the topic filters . The List of topic filters side panel that enables you to manage existing filters or add a new one opens. To add a new topic filter, select + Add Item in the Topic Filters area.
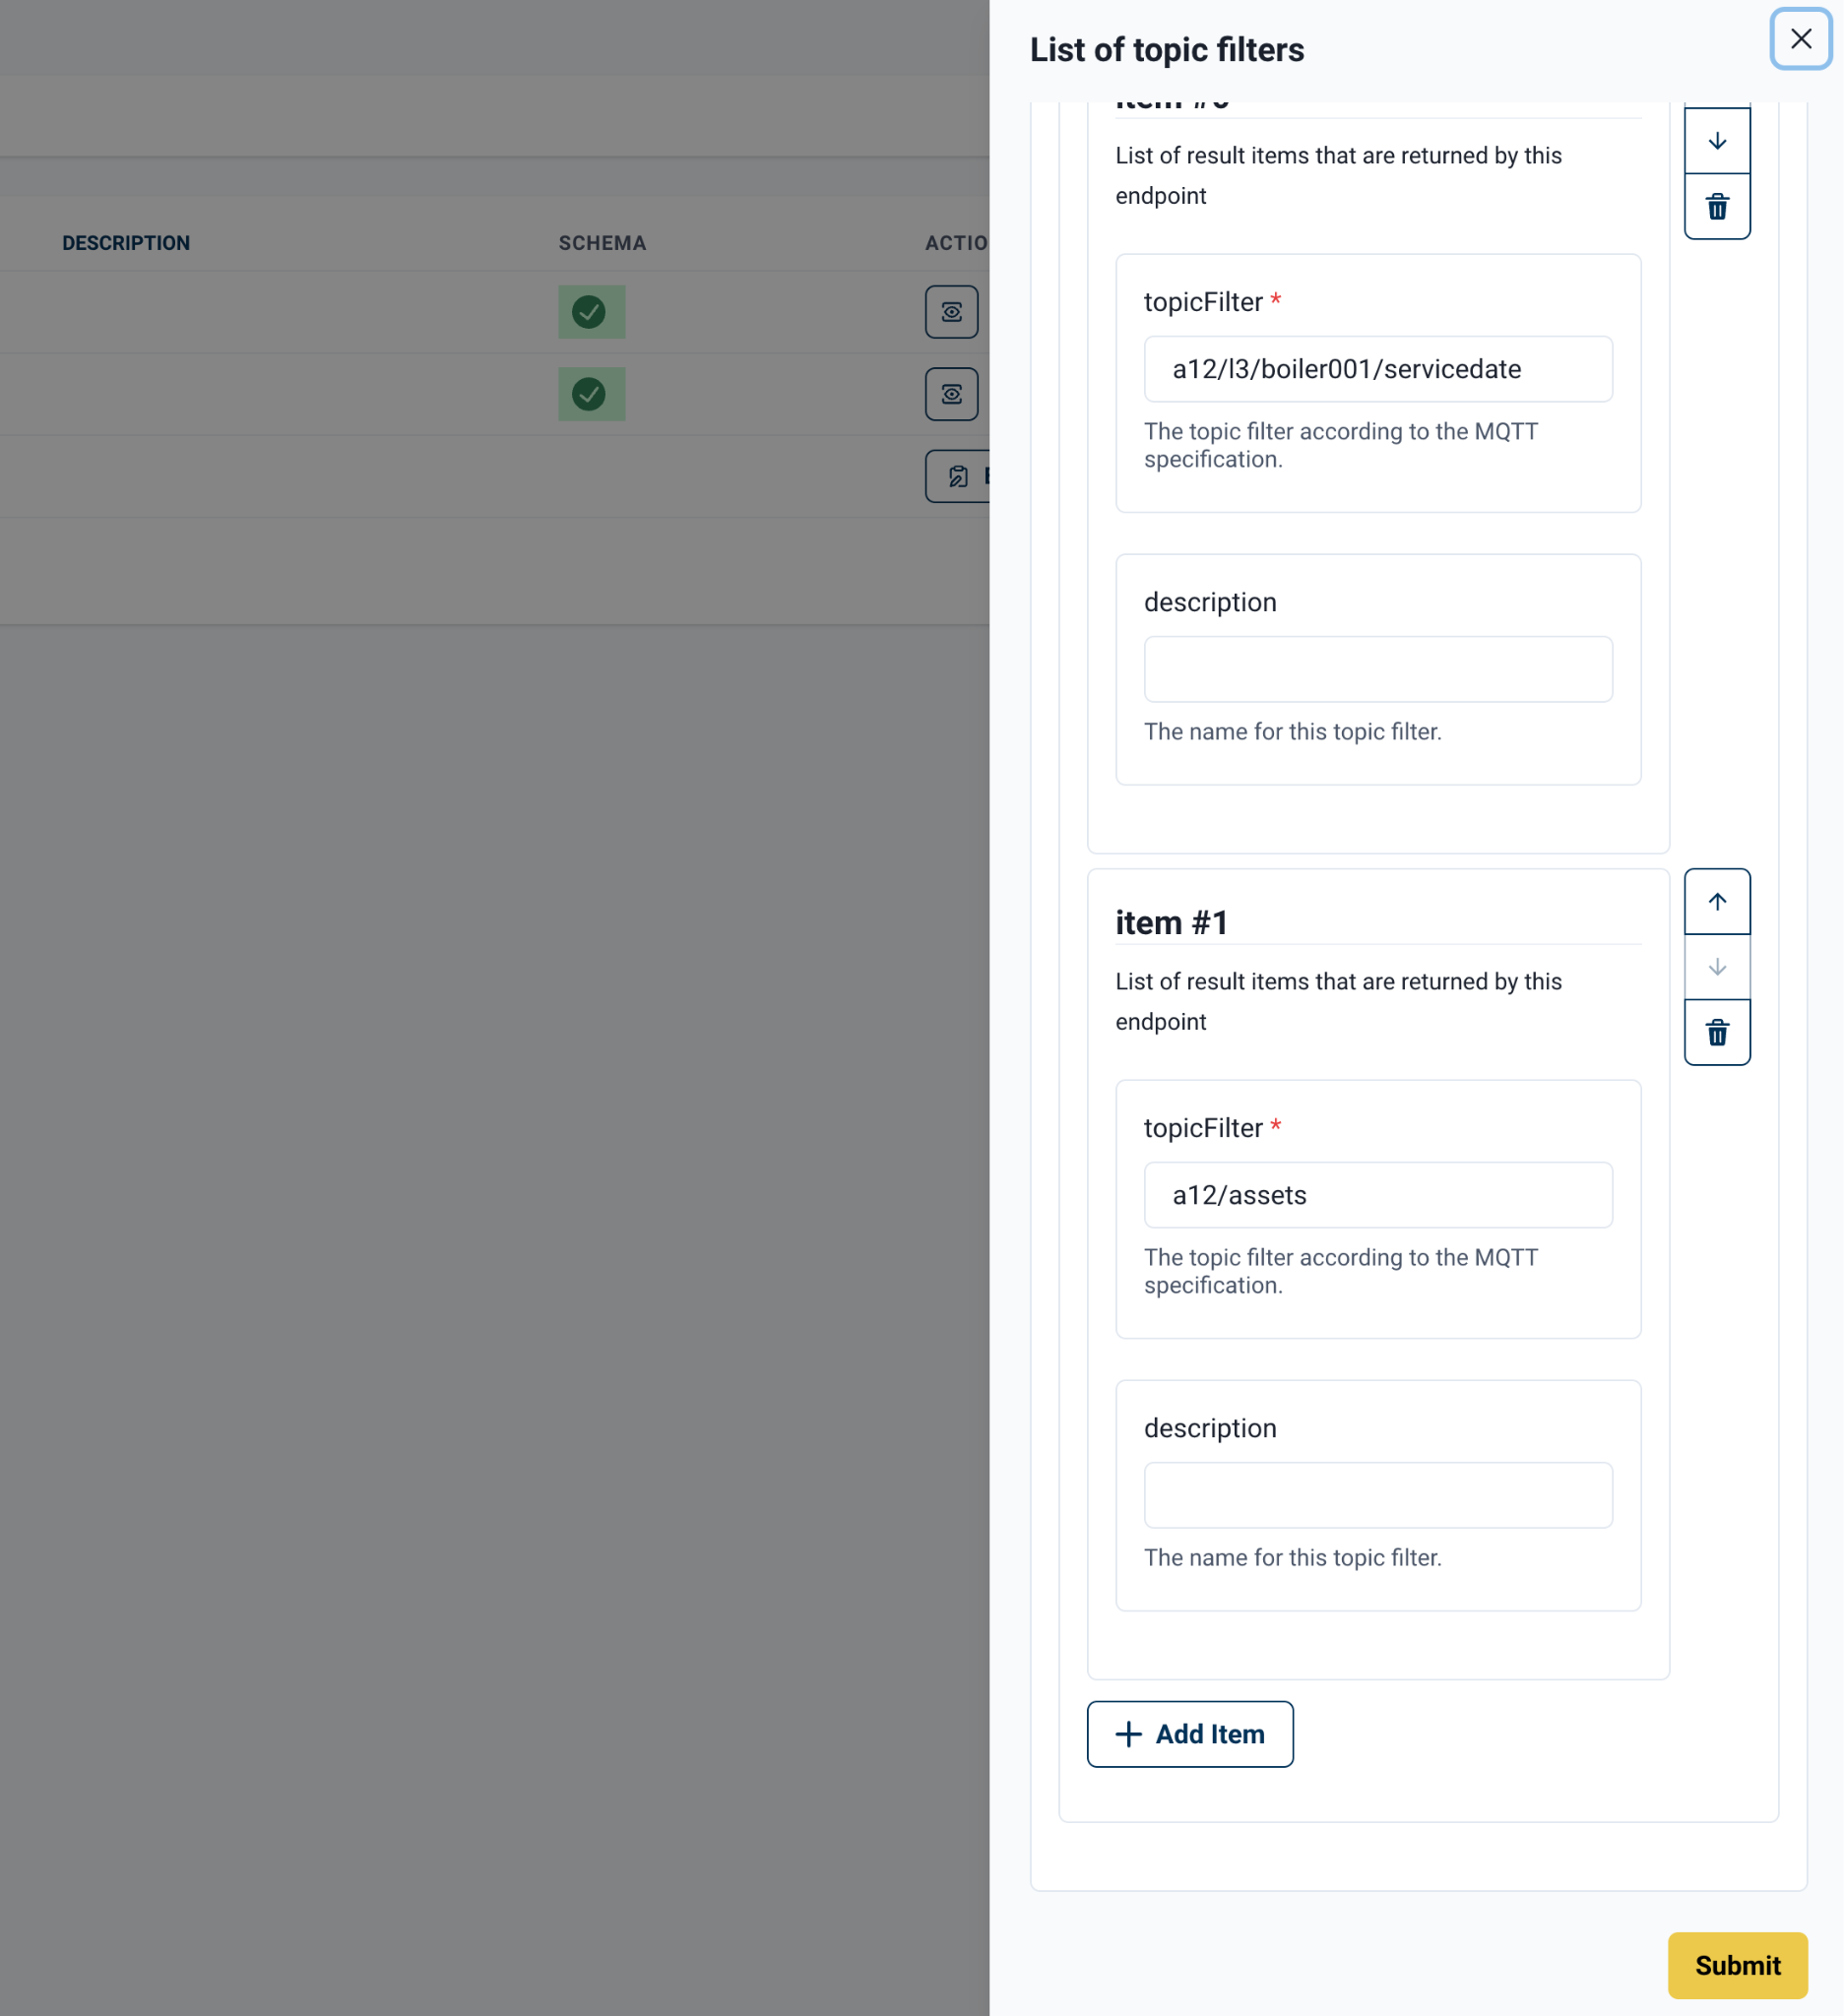
To add a topic filter, enter a topicFilter and optional description fields. To save your entries, select Submit.
| The topicFilter field must exactly match an existing topic within your Edge Broker for the infer schema option to function correctly. For topics that are not yet published, you must provide a schema. |
Back in the ‘Manage topic filters’ you can manage a filter’s schema, click the ‘eye’ icon on the line item to get an additional pane to view the ‘Current Schema’ (with a sample of the data), ‘Infer a schema’ or ‘Upload a new schema’.
| Manual schema assignments must use JSON-Schema. |

After you infer or upload a schema, a notification informs you that a valid schema is present for the topic filter.
HiveMQ Edge Workspace Broker Node Overview Panel
You can access the Edge Broker node overview by selecting the sidebar icon on the node overlay toolbar for HiveMQ Edge. This will activate a panel from the right hand side that will provide additional views.

The initial view is an interactive graph that shows all of the configured connections to Edge in the example above are connected OPC-UA, HTTP, File and HiveMQ Cloud connections. Additional interactive views of configured tags, topics and devices can be accessed in this pane.
The configuration button enables grouping of connections on the ‘Workspace Cluster’ view.
HiveMQ Edge Workspace Bridge Nodes
The Bridge Nodes are two separate elements on the Workspace, the Bridge Configuration and Bridge Destination.

The Bridge Configuration node displays the user configured name, connection status and any configured topic filters. ‘+’ symbol denoting additional topic filters not in view on the node. The Bridge Destination node provides information on the end point where the Bridge is connected to, in the example above its HiveMQ Cloud.
| The Bridge Destination node is currently a placeholder, without any active features. |

When you select the Bridge Configuration node, an overlay toolbar appears with the following available options:
-
Create a data combiner from selection (arrows join), you can create a data combination from bridge topic filters.
-
Open the overview panel (sidebar icon), opens the Overview Panel from the right hand side of the screen.
HiveMQ Edge Workspace Bridge Configuration Node Overview Panel
You can access the Edge Bridge Configuration node overview by selecting the sidebar icon on the node overlay toolbar for the bridge. This will activate a panel from the right hand side that will provide additional views.

The panel provides a configurable metrics view where users can select additional metrics to display in the same way the Observability Panels function. The panel also provides the most recent 5 events for the Bridge from the ‘Event Log’ at the bottom are options to Modify the bridge and Stop and Restart the Bridge, as you would find in the ‘MQTT Bridges’ list accessible via the main menu.
HiveMQ Edge Workspace Protocol Nodes
Protocol Adapter nodes on the canvas are always connected to a Device node. This is where the adapter configuration can be accessed. Tags mapped to the device, as well as Northbound and Southbound MQTT topics mapped to tags are available via these node interfaces.
When you create a Protocol Adapter in Edge, these nodes become interactable elements on the canvas.

HiveMQ Edge Workspace Device Node
The Device node represents the device or endpoint that the Protocol Adapter is connected to. If tags have already been configured for the device, they are listed in the node. A + symbol indicates that more tags are available than those on view.
The device node also shows the capabilities that the device-adapter setup offers: supports data combining (joining arrow), northbound mappings (outbound arrow), southbound mappings (inbound arrow), and data discoverability (compass).

When you select a Device node on the canvas, the Edit device tags (tag icon) option becomes available in the overlay toolbar. Select this option to open a panel on the right of the screen to manage device tags.

The device overview panel offers a list of pre-populated tags to choose from. The List of tags is paginated, and a you can select the number of tags to view based on your display area and preference. To add a tag, select the + symbol.

Adding a new tag will create an ‘< unset >’ item to the list. Click on the pencil icon to edit this tag or the bin icon to delete it. When all tags necessary have been mapped to Edge then select ‘Submit’ in the bottom right of the pane to go back to the Workspace canvas.
Tag creation fields vary based on the parameters of the device. For example, OPC-UA requests a NodeID whereas S7 asks for a Tag Address.
|
HiveMQ Edge Workspace Adapter Node
The Adapter node represents a configured HiveMQ Edge Protocol Adapter. This is where you manage MQTT mappings. All mapped topics are displayed in the node. A + symbol indicates more mappings are available than those on view.

Selecting an Adapter node will bring up the node overlay toolbar.

The options available are:
-
Edit Northbound mappings (box, arrow out), enables users to map tags to MQTT topics.
-
Edit Southbound mappings (box, arrow in): Maps MQTT topic filters back to OT data sources.
-
Create a data combiner from selection (arrows join): Creates combinations from tags and topic filters.
-
Open the overview panel (sidebar icon): Opens the Overview Panel from the right side of the screen.
HiveMQ Edge Workspace Adapter Node Northbound Tag Mappings
To map tags to MQTT topics, select Edit Northbound mappings from the Adapter node overlay toolbar to open a new window.

The Manage Northbound mappings window lists all northbound mappings that are currently available. To add a new mapping, select + Add a mapping.
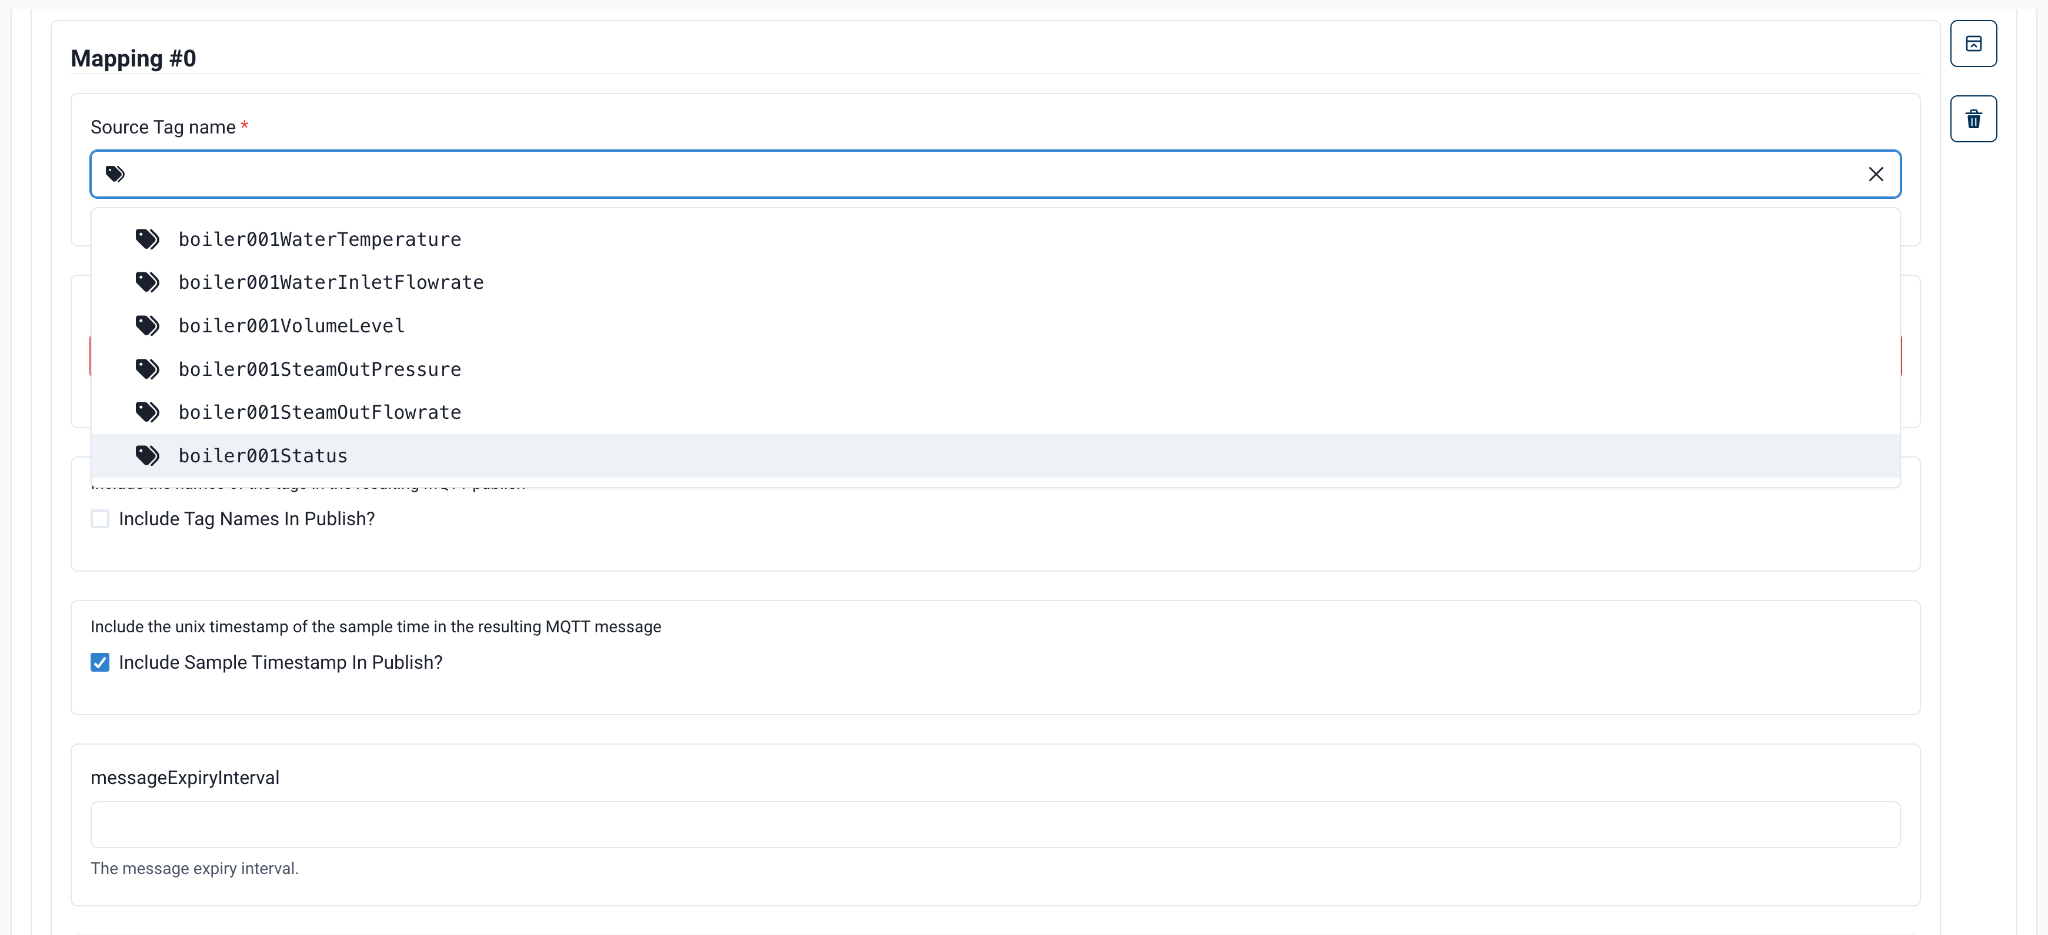
When you add a new mapping, the Source Tag Name and Destination Topic fields are mandatory. The Source Tag Name field provides a drop-down list of mapped tags on the associated device to choose from.

| Destination Topics can be created on the fly in the editor. However, BEFORE you configure a northbound mapping, you MUST create all tags required for the northbound mapping in the corresponding device. |
After you define the source tag and destination topic, you can review the following additional options:
-
Include Tag Names in Publish?: Adds the label of the source tag into the MQTT payload.
-
Include Sample Timestamp in Publish?: Adds the timestamp of when HiveMQ Edge captured the data to the MQTT payload.
-
Message Expiry Interval: Sets the MQTT message expiry interval. If left empty, the default message expiry interval is used.
-
MQTT QoS: Selects an MQTT QoS level for the selected mapping.
Note: This field is also mandatory, but has QoS 0 selected by default.

To view additional options in the MQTT User Properties section select + Add an MQTT User Property. A view to provide two custom user property fields that are published as static data into the topic payload every time HiveMQ Edge samples the device tag opens. To add more than one property, select + Add a user property.
To continue mapping additional tags to topics, select the + Add a mapping at the bottom of the MQTT mapping panel. To save your mappings, close the panel, and return to the list of mapped topics, select Submit.
HiveMQ Edge Workspace Adapter Node Southbound Tag Mappings
To map MQTT data to tags, select Edit Southbound mappings from the Adapter node overlay toolbar to open a new window.

A List of Southbound mappings will be presented, to add a new mapping select the ‘+’ symbol at the bottom of the list. Then select the pencil icon on the ‘< unset >’ mapping that’s just been created.

This opens the Mapping Editor for the <unset> Southbound Mapping.

Select the Source Topic Filter and Destination Device Tag fields to view a list of available topic filters for mapping and a list of the tags available for the current device connected to the Protocol Adapter.
| Both the topic filter and the tag MUST exist before being selected in a southbound mapping: topic filters in the Edge node and tags in the relevant Device node. |

When a user selects a source it provides the topic filter schema and a sample of the data being published, and when you select a destination device tag it provides the expected schema to be written to. Mapping is done using a drag and drop motion from the topic schema attributes to the tag schema attributes, The attributes of the tag schema are labeled with a symbol that denotes the expected data type. In the example above the ‘value’ attribute field is expecting an integer. If you pull another data type such as string the field will remain unmatched and a user cannot save the mapping. Use the ‘Save’ button in the bottom right of the view to commit the mapping.
| HiveMQ Edge verifies only that the data presented is of the expected data type based on the available OT schema. HiveMQ Edge does not validate the data sent to OT data sources to be the correct value. Users are strongly advised to test southbound mappings on non-operational setups before configuring southbound data flows on operational systems. |

Southbound mapped topics appear at the top of the Adapter node on the Workspace canvas once configured.
HiveMQ Edge Workspace Adapter Node Overview Panel
To access the Adapter node overview, select the sidebar icon on the node overlay toolbar for the adapter. This option opens a panel from the right side of the screen that provides additional views.

The panel provides a configurable metrics view where you can select additional metrics to display in the same way the Observability Panels function. The panel also provides the most recent 5 events for the adapter from the ‘Event Log’ at the bottom are options to Modify the adapter and Stop and Restart the Adapter, as you would find in the ‘Protocol Adapters’ list accessible via the main menu.
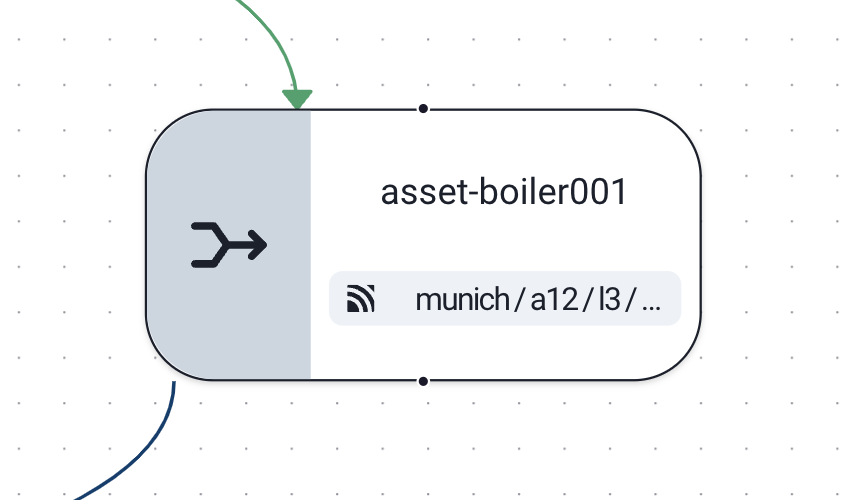
HiveMQ Edge Workspace Combiner Node
On the Workspace canvas, Combiner nodes are represented with rounded corners and the arrows joining icon. They are connected to the nodes on the canvas that provide the combinations mapped data sources. The node displays the combiner name and destination MQTT topics to which messages arepublished. A _+_ symbol indicates additional destination topics, if available.
To create a data combination on the Workspace canvas, select Adapter nodes and/or the Broker node and use the Create a data combination from selection’ option. For more information, see Data Combining in HiveMQ Edge. This section focuses on the Workspace node only.

When you select a Combiner node, a node overlay toolbar on which only the Open the overview panel (sidebar icon) is available. Select the sidebar icon to open the Overview Panel from the right side of the screen.
HiveMQ Edge Workspace Combiner Node Overview Panel
To access the Combiner node overview, select the sidebar icon on the node overlay toolbar for the adapter. This option opens a panel on the right side of the screen with additional views.
The overview panel provides options to manage the sources of the data combiner and mappings, and offers basic labelling and description options. For more information, see Data Combining.